
Welcome back to NeedlePoints of View, a monthly column brought to you by Emma of The Maker’s Marks and Hannelore of Hedgehog Needlepoint, where we’ll be sharing our love of all things needlepoint. Whether you’re new to the craft and want to learn what it’s all about or you’ve already fallen under needlepoint’s spell, we hope to inspire you to pick up a needle and get stitching.
Stitching from a Chart
Needlepoint can sometimes be an expensive hobby. Tapestry wool being a specialist wool, is a bit more costly than your regular knitting wool, it’s what you’ll find in most kits out there, and if you’re shopping Stateside you’ll be keenly aware of the price tag on hand painted canvasses.


Images L – Jenny Henry hand painted canvasses, R – image from Needlepoint: A Modern Stitch Directory
And the costs are understandable; hand painting takes an age, you’re getting a mini artwork. And the sheer volume of work that goes in to creating a needlepoint kit, with all it’s component parts, well don’t even get me started!
So whilst you’re saving up for your next big project how about trying your hand at a counted needlepoint piece working from a chart. What better way to use up your thread stash!
What to expect & how to approach it
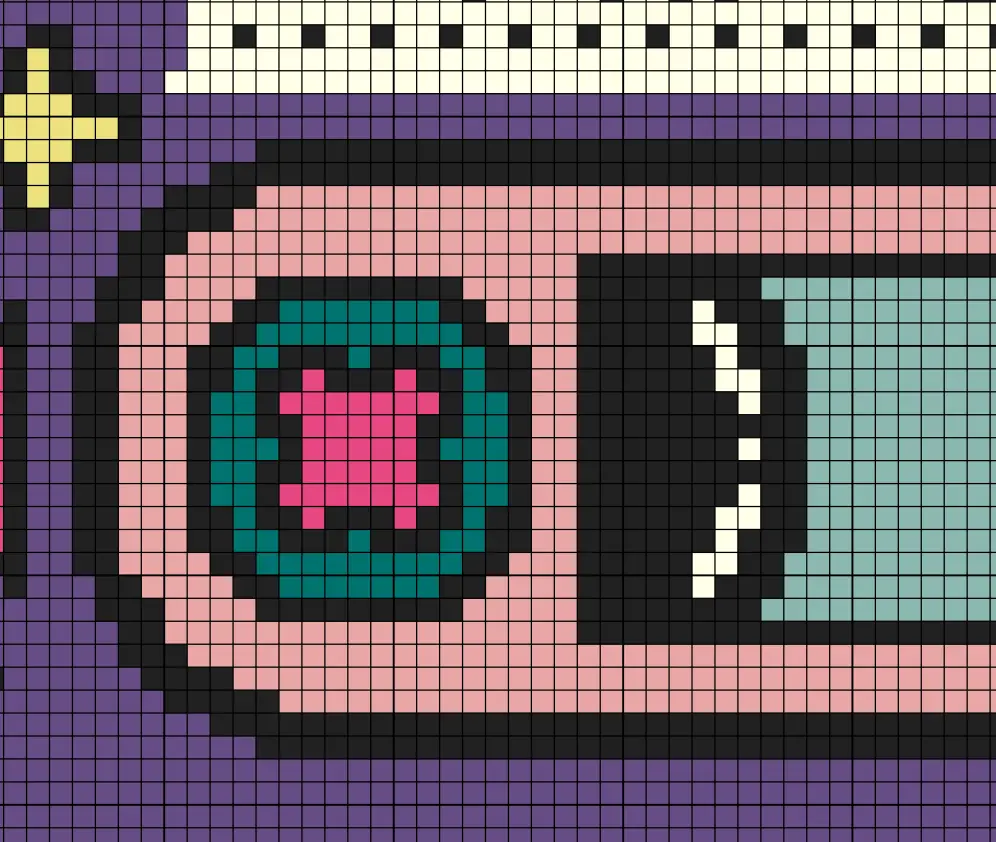
When you buy a chart you’ll get a pixel based picture pdf, likely list of the materials you’ll need, what wool brand colours etc and normally an indication of how many stitches are done in each colour.
The pixel like squares in charts make them easy to follow. Each square represents a canvas intersection (where the warp and weft of canvas crosses over each other), so if you’re working a project in one of the Tent stitches or a Cross Stitch it’s really easy to work out how many stitches you will be making. One pixel = one stitch.


Images L – Section from my Mix It Up kit, R – the corresponding section on the chart


Images L – Close up of the canvas warp & weft, R – Diagram of how the stitches sit on the intersections
What about decorative stitches?
But how do you approach a chart if you’re working outside of Tent & Cross stitches?
If you’re working with straight stitches, like Satin Stitch, then you won’t be going over canvas intersections. This time you’ll be going over canvas bars, these are the threads of canvas in-between the intersections, the vertical and horizontal straight bars. In this case each pixel square will represent your thread crossing over a canvas bar.


Images L – Close up of the canvas warp & weft, R – Diagram of how the stitches sit on the bars
When you’re using decorative stitches, that stretch themselves over bars and intersections at varying lengths, then your pixel squares become an indicator of the area of canvas to cover. This is where your judgement comes in to play and you may find yourself needing to add some compensating stitches to perfectly fill the area; little part sized stitches. More on these another time.
Mystery solved
So with all this knowledge in hand you can buy any chart and merrily stitch it with confidence. And if you’re still feeling a bit unsure feel free to chat to me on Instagram and I can give you any extra help you need.